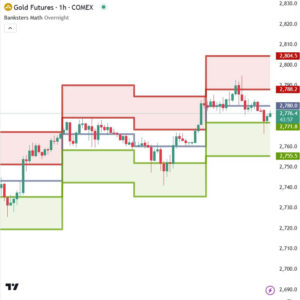

Bankmath v2.0 is a Gaussian model which shows price lines initially used to analyze oil futures prices with the use of all available price data and variance to follow the Bell curve. This indicator shows you reversal points and zones where to buy and to sell trades on every chart, market and timeframe. Bathmath Indicator for NinjaTrader is an indicator used to detect reversal movements in the market, according to the average price considered by the standard deviation of prices during a given period. The indicator uses statistical calculations of the Gaussian curve concept with daily and weekly data:
- Between the open and +-1 standard deviation are 68% of the observations.
- Between the mean and +-2 standard deviations are 95% of the observations.
- The standard deviations are shown in crosses and all indicator labels can be checked on NinjaTrader.
The trader can define if the daily or weekly data is to be shown.
How is Bankmath v2.0 different from other indicators?
- It is designed specifically for the mean reversion strategy.
- Lines are shown representing price mean +- standard deviation.
- It works well in conjunction with our other indicators to confirm entry/exit signals.
- It helps identify good “pair trading” opportunities.
- It can be applied to all markets and timeframes.
How do I use the indicator?
- Please contact us for details.
- Read our user manual for all the best tips on how to use our indicators as part of a range trading strategy.
- Feel free to reach out to us for personal one-on-one help with getting started.
- Bankmath v2.0 does not replace price action analysis which should be done first.
- Find reversal points and a move from the open to +- 0.5 sdev (90% of moves). Or try to find moves from 0.5 sdev to +1 sdev. Approximately 68% of the prices move this much. Only 7% of the time does Oil move from +-1 to +-2 sdev.
What Markets and Conditions Does It Work Best On?
Bankmath v2.0 is primarily designed for day trading and swing trading. Some zones of reversal work as oversold and overbought levels which are based on current and past volatility around a dynamic average price.
The best reversal zones are:
- The danger zone (previous 7 day price mean).
- 30 day/week price mean.
- Bankmath High / Low (Crude Oil model A adapted).
- Bankmath Low (daily/weekly’s low mean).
- 5 day/week price mean.
- 10 day/week price mean.
Be sure to use weekly levels for NY session and 24h levels for London Zone!
Indicators should be used as part of a trading strategy to assist in making decisions, in order to give you an edge, instead of just blindly following every signal they produce you should always seek to compliment technical trading signals with additional analysis to reduce your risk and increase your odds of making a winning trade.