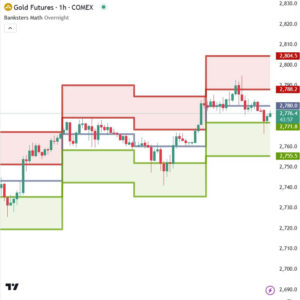


Bankster’s Math is a gaussian indicator where we use the expected volatility from the previous day to calculate standard deviations and predict the daily high (Bankster’s Math High) and low (Bankster’s Math Low).
The working area where you can place trades is divided into 3 thirds:
- Upper third (red): supply zone. It’s where there are more sellers than buyers. You shouldn’t buy there.
- Lower third (green): demand zone. It’s where there are more buyers than sellers. You shouldn’t sell there.
- Midpoint. It’s no man’s land. Prices holding above the midpoint tend to go up to touch the supply area. On the other hand prices moving below the midpoint should test the lower third.
- Bankster’s High – it’s the expected daily high.
- Bankster’s Low – it’s the expected daily low.
How the indicator works:
You should do your analysis considering higher timeframes and then use Bankster’s Math.
When an asset is trending or sideways, Bankster’s Math has the best results.
When you are day trading, you should consider buying when the indicator is at the demand zone (green) and sell when the prices reach the supply zone (red). Nevertheless, with Bankster’s Math you should not just take a trade because it’s in the upper area and decide to short sell any asset because you saw red. If the prices are already in the upper area and there’s another reason, Bankster’s Math is like a layer of confidence for you. You still have to figure out what is the trend to decide if it is better for you to buy or to sell because you should start with a bias before using the indicator.
Exception: when you have a strong daily buy and at 60m timeframe and prices are at the supply area, and market volatility is low, perhaps you shouldn’t short it and just wait for the next day. Same thing when the indicator shows prices at the demand area and you have a strong daily selloff. This is when you should wait for the next day despite the fact that prices are at a red or green location.
Which timeframes works best for Bankster’s Math:
- 15m
- 60m
Indicator Options:
When you go to the Bankster’s Math settings, you can choose if you want to consider as the main value:
- The previous close
- Overnight (for futures and crypto which trade 24h)
- The open (good to use especially for gaps)
Indicators should be used as part of a trading strategy to assist in making decisions, in order to give you an edge, instead of just blindly following every signal they produce you should always seek to compliment technical trading signals with additional analysis to reduce your risk and increase your odds of making a winning trade.